Cross shopping, in SafeGraph’s definition, is the share of one tenant’s visitors who also visit another place in your shopping venue. Oftentimes it’s one proof a tenant wants before signing a lease with the landlord: do the grocery anchor’s shoppers walk past this unit, and how would they show it?
Syndicate sells shopping centres their own shopper app and operator dashboard, so we have a stake in what you choose.
What does a prospective tenant want to see?
Your leasing deck probably has door counts, sales per square foot and a tenant mix. In the age of eCommerce, the tenant across the table wants something AI-powered, visual and measured. If the tenant asked you who walks past their unit, and whether or not people shop in that vacant unit, would you be able to provide the answers?
Door counts tell you how many people came in, and sales tell you what they bought. The walk in between, from the grocery anchor to the fashion wing, is the part most shopping venues can’t show a tenant yet.
How is cross shopping measured?
SafeGraph’s guide to cross-shopping analysis (last modified October 2026) makes three points worth keeping in your deck.
First, overlap is not symmetrical: the share of shop A’s visitors who go to shop B can be very different from the share of B’s visitors who go to shop A.
Second, the time window changes the answer. The same-visit window shows stores that people combine in one trip. However, a month shows broader habits.
Third, there’s something called the affinity index: this compares the proportional overlap you’ve currently measured, with what you’d expect from each store’s size. That makes sure the biggest sales floor doesn’t win every comparison.
SafeGraph lists three data sources: phone location visits, card transactions and web browsing. A shopping venue has its own options, and each one has a different blind spot.
What are the five ways to see between the door and the point of sale?
All five are already in use in shopping centres, and each one leaves a different gap in the picture.
| Method | What it shows | Store to store? | Consent load | Its strong case |
|---|---|---|---|---|
| Door counters | Visits in and out of each entrance | No | Low, no personal data | Counts everyone who walks in, with no personal data |
| Camera counting | Traffic past a screen or zone, sometimes estimated age and gender | Within view of each camera | High if faces are analyzed | No app needed; Westfield Rise announced Quividi audience measurement for its US screens |
| Wi-Fi analytics | Devices on your Wi-Fi and roughly where | Zones, depending on access points | Medium, set at Wi-Fi sign-in | Uses equipment you have; Simon uses Wi-Fi location data with Adentro |
| Panel data (Placer.ai and others) | Estimated visits from a sample of phones | Between places, as estimates | Handled by the provider | No install; in the US, covers competitors’ centres too |
| Your own app | Opted-in shoppers entering geofenced zones, and what they did with your offers | Zones; individual stores need careful planning | High, location consent rules apply | Links a message to a visit, and the audience is yours |
Panel data deserves a fair hearing. Placer.ai’s data page, checked November 2026, describes a panel of tens of millions of devices, with visits estimated by machine learning, covering any location in the US. The page doesn’t mention Canada, so ask whether your property is covered before you subscribe.
Cameras come with a warning. In 2020, the federal, Alberta and British Columbia privacy commissioners found that Cadillac Fairview collected 5 million images of shoppers through cameras in its mall directories without meaningful consent. Our Law 25 guide for shopping centre apps covers that case in more detail.
What can your own app show that the others can’t?
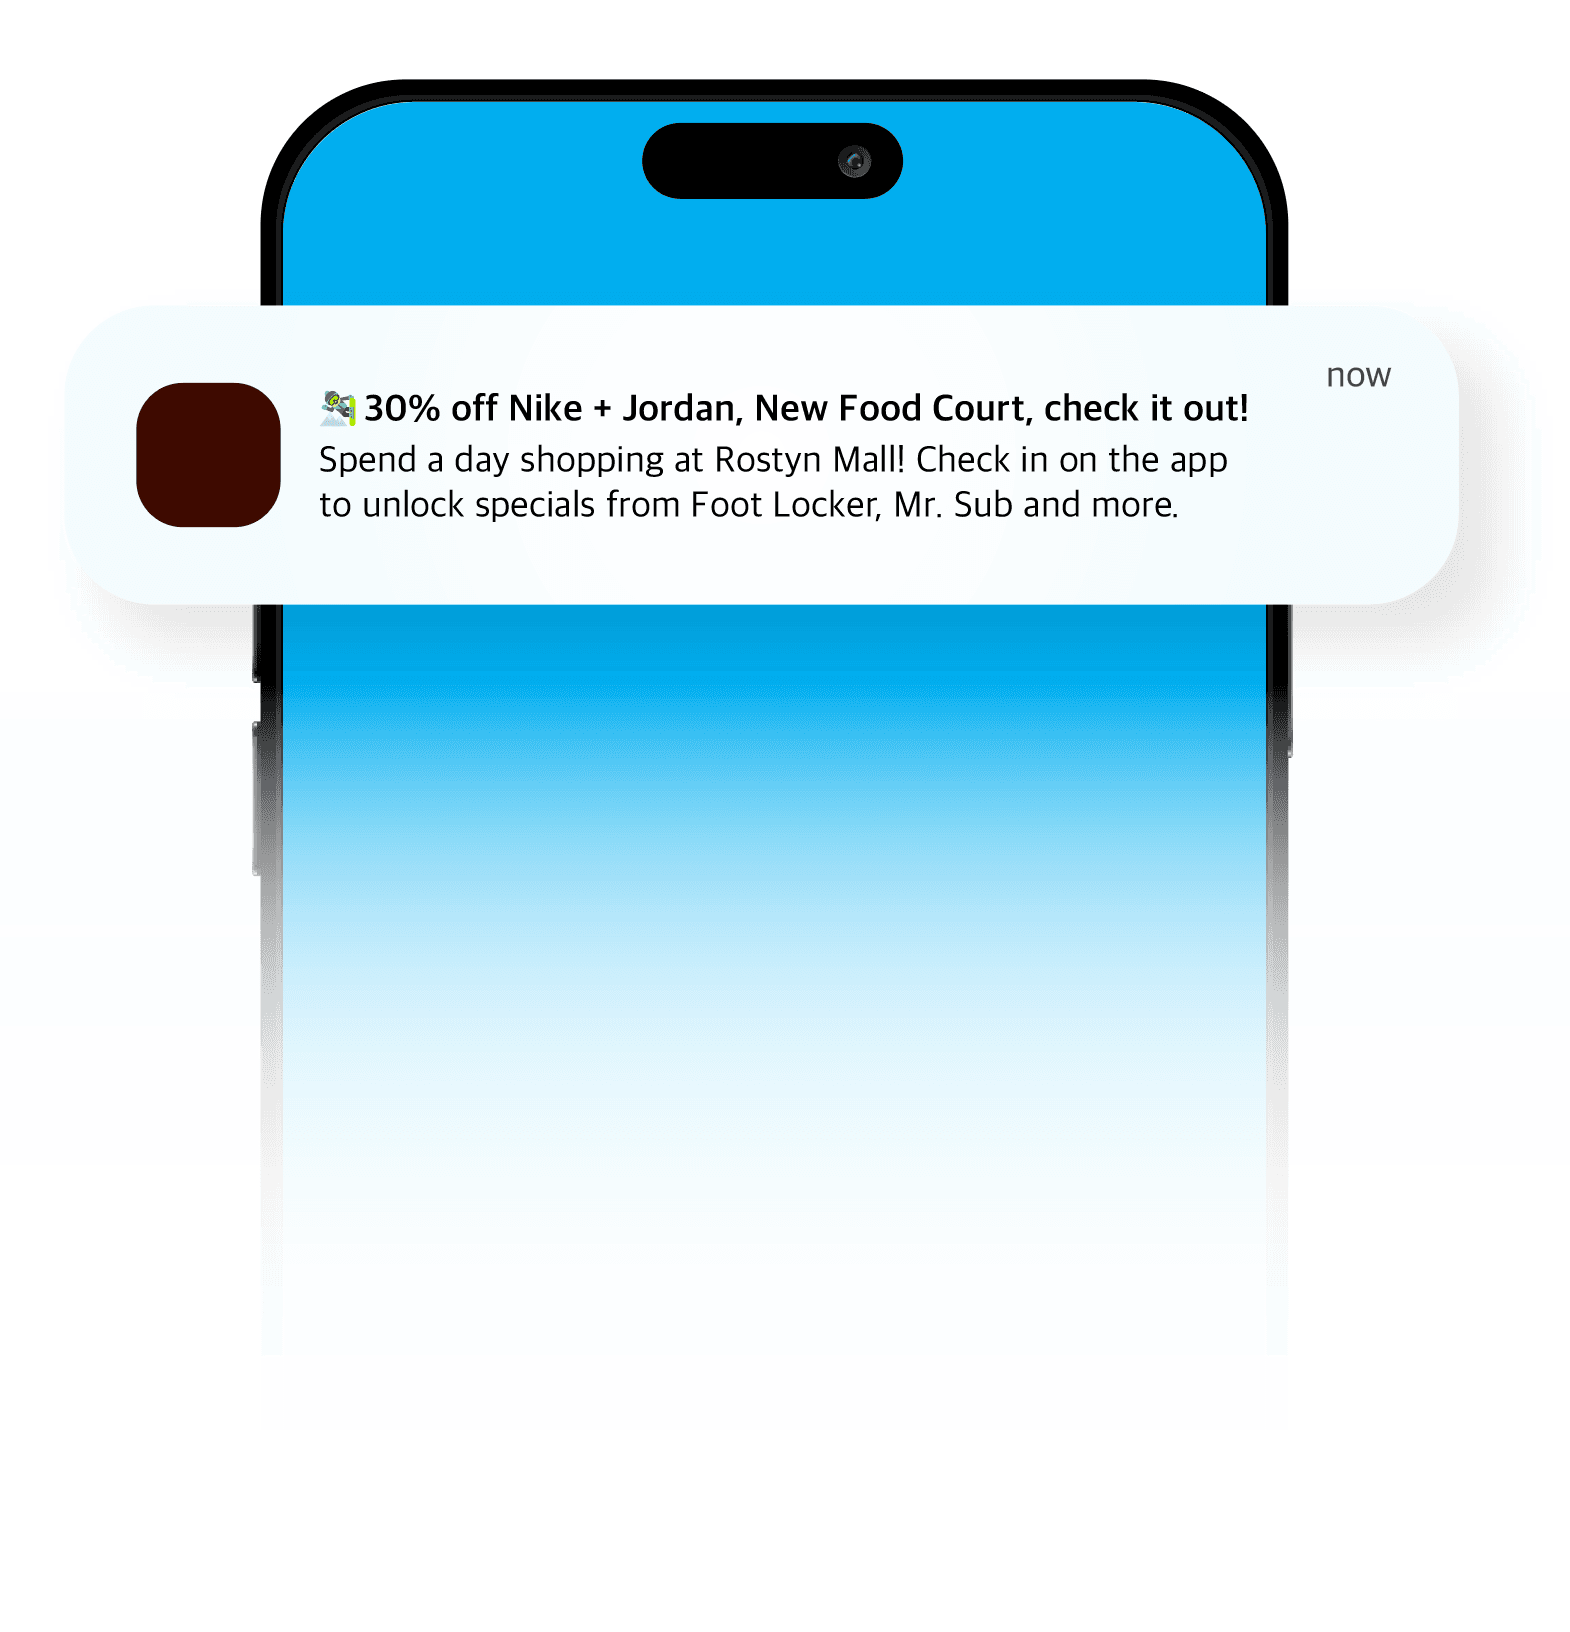
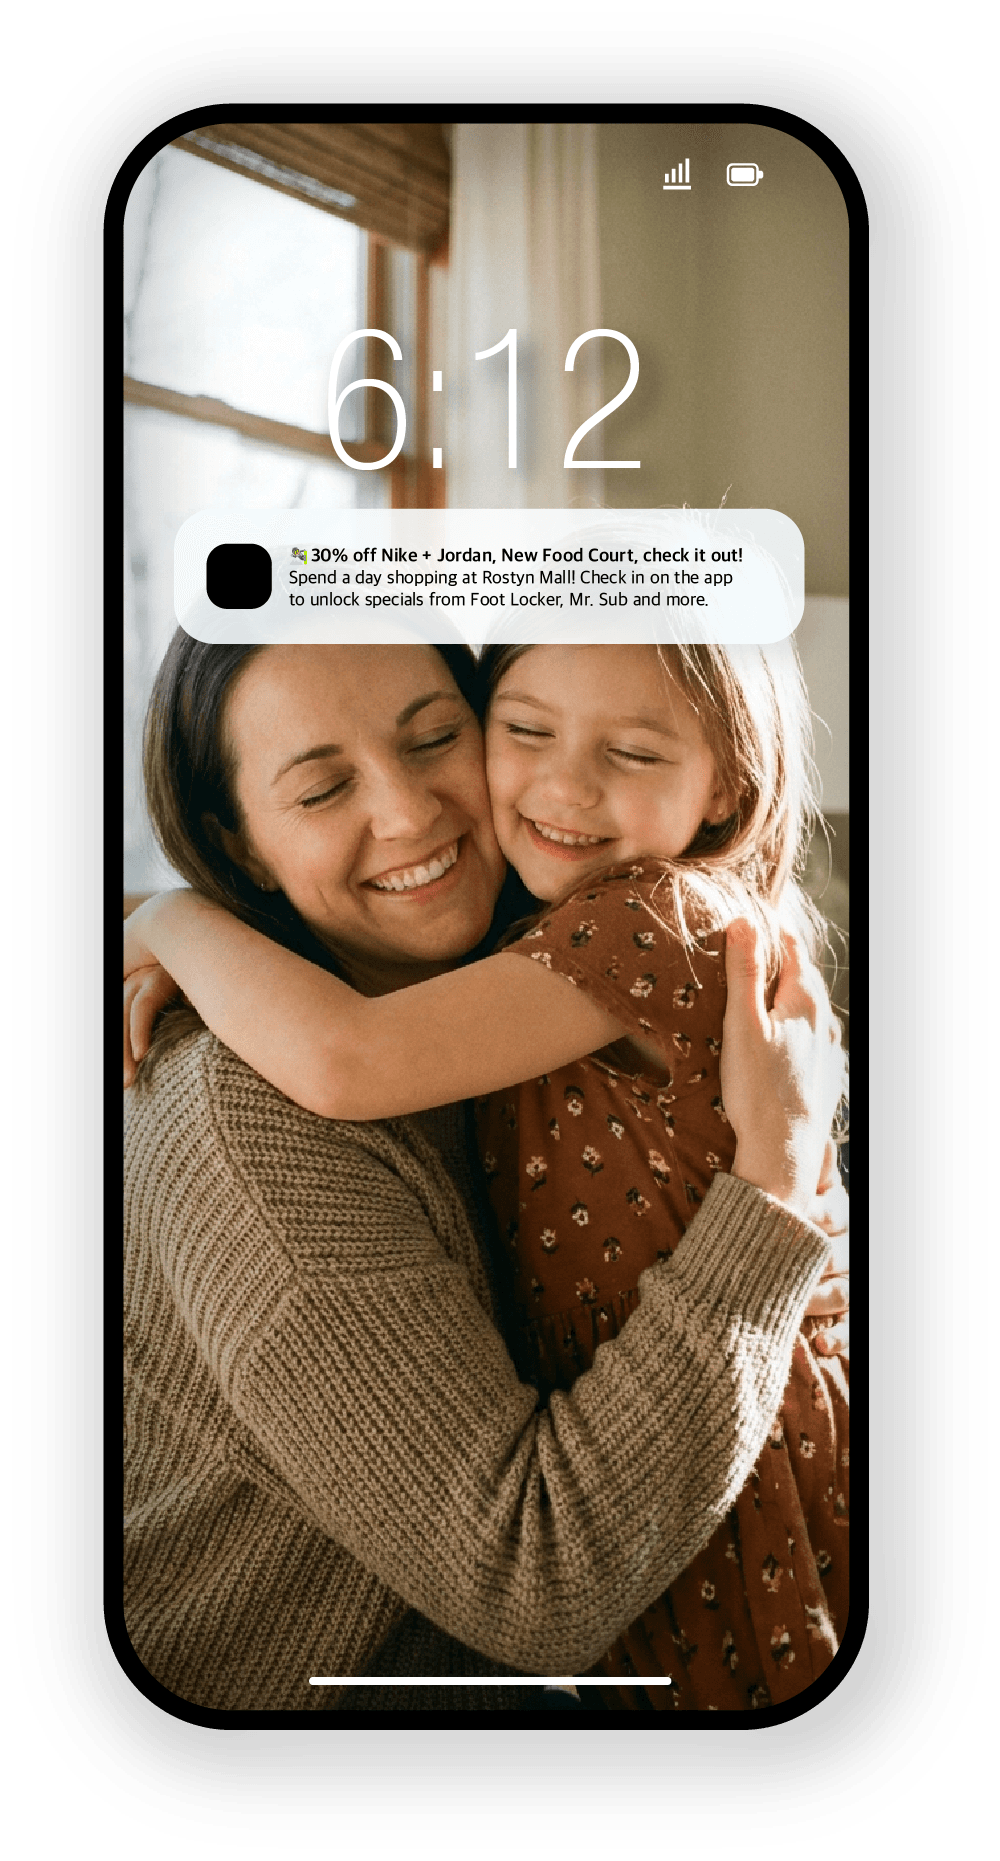
Your own app connects a message to a movement. A shopper pulls into your parking, gets an offer from one of your fashion tenants, opens it and heads inside, and of the five methods, only the app ties those two moments to the same person.
Keep Apple’s limits in mind when you plan it. Apple’s Core Location documentation limits a single iPhone app to 20 monitored regions at a time, and a phone places itself less precisely indoors than outdoors. That’s why an app works best with larger zones, like your property, your parking or a whole wing, so shoppers don’t have trouble triggering them.
App data also only counts people who opted in, meaning they installed your app and allowed location access. That makes it a picture of your app users rather than every shopper.
Say so on the slide, so the tenant knows exactly where the number comes from. Our questions for a shopping centre app demo help you test all of this before you sign.
What about loyalty and sales data?
The five methods above track movement, while purchase data tracks spending, and spending is often the strongest cross-shopping evidence a tenant will see. SafeGraph also lists card transactions as one of its three sources.
A shopping venue can get purchase data two ways. Tenant sales reports, where your leases require them, show what each store sold, and a loyalty program shows which stores the same member bought from, as long as members scan or tap at the point of sale. The limit is the same as with an app: you see your members, not every shopper.
What could the slide in your leasing deck say?
This is a template, not a result. Every bracket is a number you’d fill in from your own data.
Example slide (hypothetical): “Of [number] loyalty members who bought at the grocery anchor on Saturdays in [month], [share] also bought at a fashion store the same day. Source: [centre name] loyalty program, members only, [dates].”
Put the opposite direction on the same slide too, from fashion back to grocery. As SafeGraph points out, the two numbers rarely match, and the tenant will want to see both. If you sell ad space, the same data helps you price it: see what a centre can sell in mall advertising.
What does Syndicate add?
With Syndicate, your shopping venue gets its own app, geofenced push notifications and an operator dashboard showing your app’s numbers. Our loyalty module puts points in shoppers’ Apple Wallet, and they earn them with a tap at the point of sale. Data export tools send all of it to your own systems, so your leasing team can build the slide from data you own.
Inside the operator dashboard, an AI advisor helps your team analyze the numbers and answers questions about them. We’d start with a pilot on one part of your property, with the zones and measures agreed before launch.
We checked these sources in November 2026.
Would it be a bad idea to see which zones your centre could measure first? Book a time or phone 1-844-404-4796.